
Here's the algorithm:
                Hire-Assistant(n)
                    best = 0
                    for i = 1 to n
                        interview candidate i
                        if i is better than best
                            best = i
                            hire(i)
The worst case: the employment agency sets us up, and sends us candidates in worst-to-best order, so we hire every single one.
We use probability theory to find an average-case running
time. This is the average over some likely distribution of
inputs.
If we don't know our likely inputs, we can't use
probabilistic analysis.
See also: Probability basics.
We best the employment agency by shuffling their list of candidates, and seeing them in random order: we get a much lower average cost, as we shall prove.
An algorithm is randomized if its behavior is
controlled not only by its inputs but also by a
random-number generator .
Random(m, n) returns with equal probability an integer between
m and n inclusive. So Random(2, 4) returns either
2, 3, or 4, each with probability 1/3.
When we randomize the algorithm we speak of an expected
running time.
Average-case running time: the probability distribution
is over inputs.
Expected running time: the algorithm itself makes
random choices.
(Note:
random variables are actually functions.)
X is an indicator variable for an event A if:
If X is an indicator variable for A, then
Exp[X] = Prob[X=1] = Prob[A happens]
This easily follows from the definition:
Exp[X] = 1 * Prob[X=1] + 0 * Prob[X=0] =
Prob[X=1] = Prob[A happens]
Example:
We throw a fair die 100 times What is the expected number
of times we get 1 or 6?
Let Xi be the indicator variable of the event "in
ith throw we got 1 or 6".
Then notice that the number of times we get 1 or 6 is:

and we want the expectation of this.
By linearity of expectations:

and by the indicator variable properties:

To summarize:

So we expect to get 1 or 6 about 33.33 times.
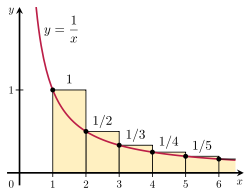
The first candidate we always hire. The second candidate will
be better half the time, the third one will be better than the
first two one third of the time, and so on, so we get the
series:
1 + 1/2 + 1/3 + 1/4...
(Or y = 1/x.)
So:


(By linearity of expectations.)

Why is the last step true?
Video here.
Basically, the anti-derivative of 1/x is ln x:
In average-case analysis, we consider run-time over a
probability distribution of inputs.
So, for Hire-Assistant, if we get candidates in order
(with higher numbers meaning better):
A1 = [1, 2, 3, 4, 5, 6, 7, 8, 9, 10]
we hire all 10 candidates. If we get:
A2 = [10, 9, 8, 7, 6, 5, 4, 3, 2, 1]
we hire only once. And if our input is:
A3 = [5, 2, 1, 8, 4, 7, 10, 9, 3, 6]
we hire three times.
So A1 is very expensive input, A2
is very cheap, and A3 is in between.
On the other hand, if we have a randomized algorithm, we can't say anything about how "good" A1, A2, and A3 are as inputs: they are randomized before the hire code runs. No particular input elicits worst-case behavior.
                 Permute-By-Sorting(A)
                    n = A.length
                    let P[1..n] be a new array
                    for i = 1 to n
                        P[i] = Random(1, n^3)
                    sort A, using P as sort keys
We cube n to get at least 1 - 1/n^3 probability that all enties are unique.
In the console below, type or paste:
                         !git clone https://gist.github.com/91e59d2a36937f9be17cee01ddb9588d.git


                         cd 91e59d2a36937f9be17cee01ddb9588d


                         from hire_assistant import *


                         n=18


                         hire_assistant(n,False)
Now you can experiment with the algorithm by changing the value of n and running hire_assistant(n, False)

Probability that two people have the same birthday: 1/365
To generalize the problem, and see it doesn't just apply to
birthdays, let's call the # of days in the year n.
Let's set up an indicator random variable so that
Xij is:
1 if persons i and j have the same birthday.
0 if the don't.
Let X count the number of pairs of people who
have the same birthday.
k is the number of people in the room.
Take expectations and apply linearity of expectation:


So we need:
k2 ≥ 2n
For 365 days in a year, square root of 730 ≈ 27.
So we are looking at Θ(n1/2),
asymptotically speaking.

b: number of bins.
n: number of balls.
Expected balls in a given bin?: n / b
Expected tosses until a given bin contains a ball?:
b
How many balls must we toss until we expect that every
bin contains at least one ball?
Call a ball falling in an empty bin a "hit."
First toss is a guaranteed hit!
For the next stage, we have i - 1 bins
containing balls, and b - i + 1 bins
empty.
So for ith stage, the probability of a hit is:
(b - i + 1) / b
So, for 6 bins, the expected tosses to fill the next bin
are:
E(n2) = 6 / 5
E(n3) = 6 / 4
E(n4) = 6 / 3
(Some math equations to be filled in!)
And we get b ln b for the expected number of
tosses until each bin has at least one ball in it.