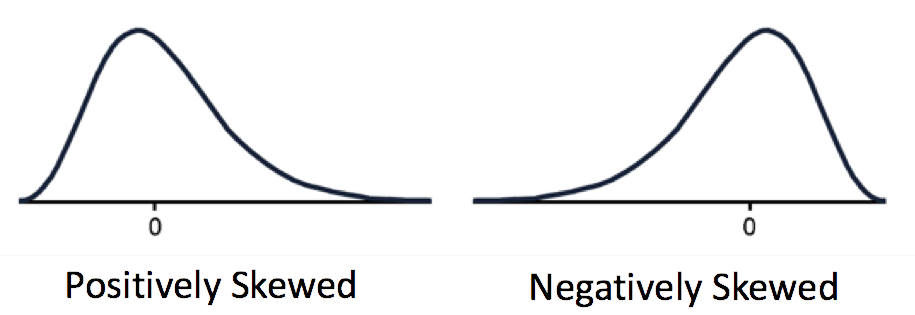
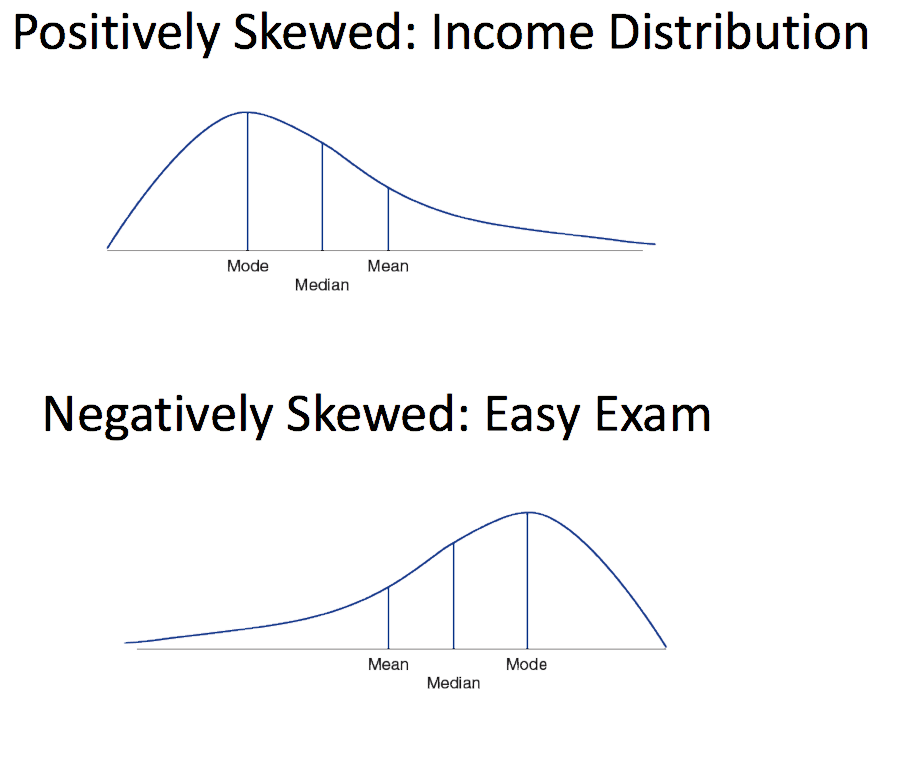
Now let us look at the effects of skewness on our three averages (measures of central tendency).
Many distributions show a bimodal pattern:
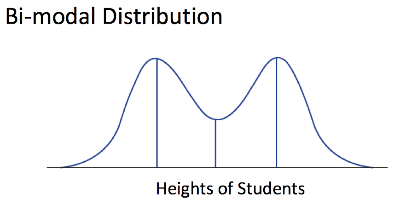


μ = 75.8, SD = 4.31
We can divide a distribution into different segments:
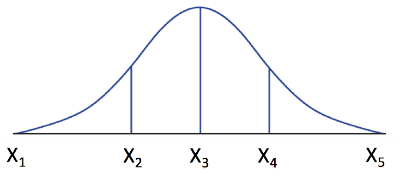
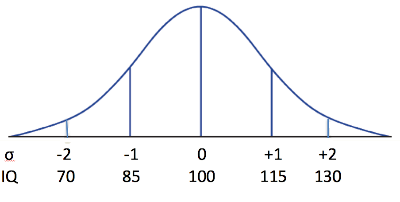
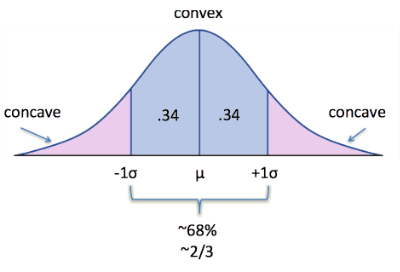
The standard deviation, in particular, divides the normal distribution as follows:
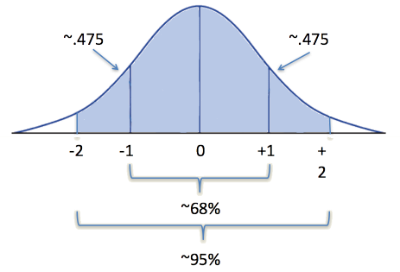
And now let's look two standard deviations out:
The IQ test was designed around a normal distribution. The mean is kept at 100, and the scores are calibrated so that 15 points = 1 SD.
| Descriptive Statistics | Nominal | Ordinal |
Interval /
Ratio |
|---|---|---|---|
| Frequency distr. | Bar or pie chart | Bar chart | Histogram |
| Central tendency | Mode | Median | Mean |
| Variability | NA | Range |
Standard devation
and z value |
There is a very complicated equation that describes the
normal distribution.
We aren't going to worry about it.
However, we should know that the normal distribution:
z score: the number of standard deviation a score is from the population mean.