Some concepts from Chapter 6 we need.
Another thing to discuss: what is the height of the average
animal?
Number of insects is estimated to be roughly
1,000,000,000,000,000,000. By comparison, the number of humans
is 7,000,000,000.
What is the mean weight of all animals going to be?
What is the mean weight of all humans?
Do we expect to see a human 1000 times the mean weight? Do we
expect to see an animal 1000 times the mean weight?
Another topic: error in scientific measurement and
the normal distribution.
The story of the English mint.
fo: observed frequency
fe: expected frequency
The professor gets you to gamble with him, betting on tosses of
his "fair" coin. He takes heads, and the first ten tosses come
up heads seven times.
Should you accuse him of cheating?
The χ2 test typically uses the α = .05
cutoff for determining the critical region or the
area of rejection.
If the χ2 value is greater than the value in our
table, we reject the null hypothesis.
The professor gets you to gamble with him, betting on tosses of
his "fair" coin. He takes heads, and the first ten tosses come
up heads nine times.
Should you accuse him of cheating?
Very important: significant means something very specific in statistics: it just means the result is in the (arbitrarily chosen) critical region.
Important concept: degrees of freedom (df).
A toss of a die has 5 degrees of freedom: once you know
the die was not 1 - 5, you know it was 6.
With more degrees of freedom, we expect more difference from
the expected value.
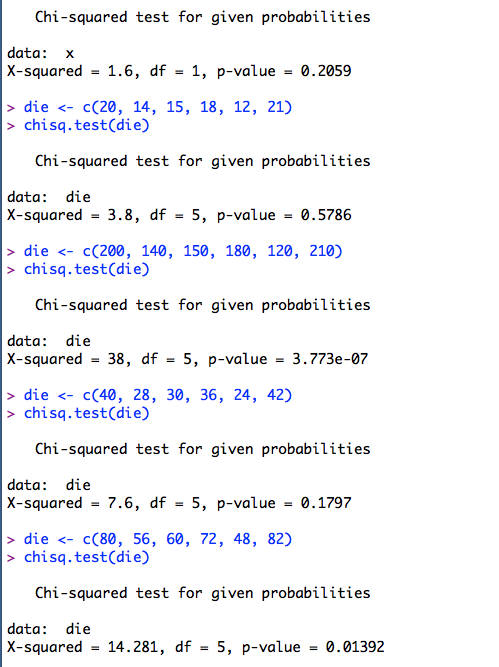
H0: we have fair dice.
H1: we don't have fair dice.
We toss the die 100 times, and get 20 ones, 14 twos, 15 threes, 18 fours, 12 fives, and 21 sixes.