

If you have many data values, you can choose classes. Principles:


The sum of all values divided by the number of values.
The middle value.
The most common value.
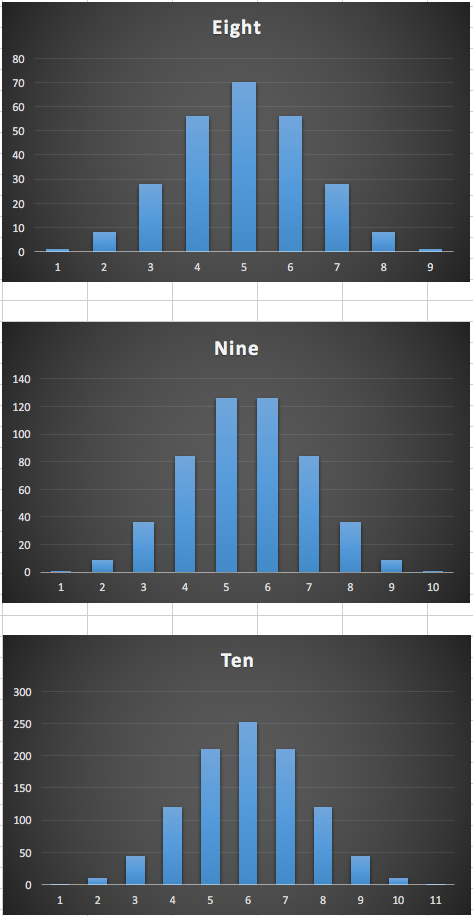
When our population has a nice, "Bell Curve" distribution, we can
use the mean.
If we have "fat tails," or a few huge values are dominate, it is
best to use the median.
If are data is just categories, without quantitative measures, we
can only use the mode.
Example: If we are asking party affiliation of SJC students,
the mean and the median are meaningless.
The spread of values.
Example: the range of grades was 63 - 98, or 35.

The average of the squared distance of all data points from the mean.
For each data point:
Why square the distance?
Consider two data samples, eaach with a mean of 5:
Sample 1: 2, 3, 4, 5, 6, 7, 8
Sample 2: 0, 5, 10
The sum of distances for Sample 1 is 12.
(3 + 2 + 1 + 0 + 1 + 2 + 3)
The sum of distances for Sample 2 is 10.
(5 + 0 + 5)
Looks like Sample 1 has more variability!
Instead sum the squares of the distances:
Sample 1: 9 + 4 + 1 + 0 + 1 + 4 + 9 = 28
Sample 2: 25 + 0 + 25 = 50
Looks like Sample 2 has more variability!
