
Here we are dealing with the mean of a sample, whereas in looking at z scores we finding the place of a single score in a distribution.
Two-tailed versus one-tailed tests:
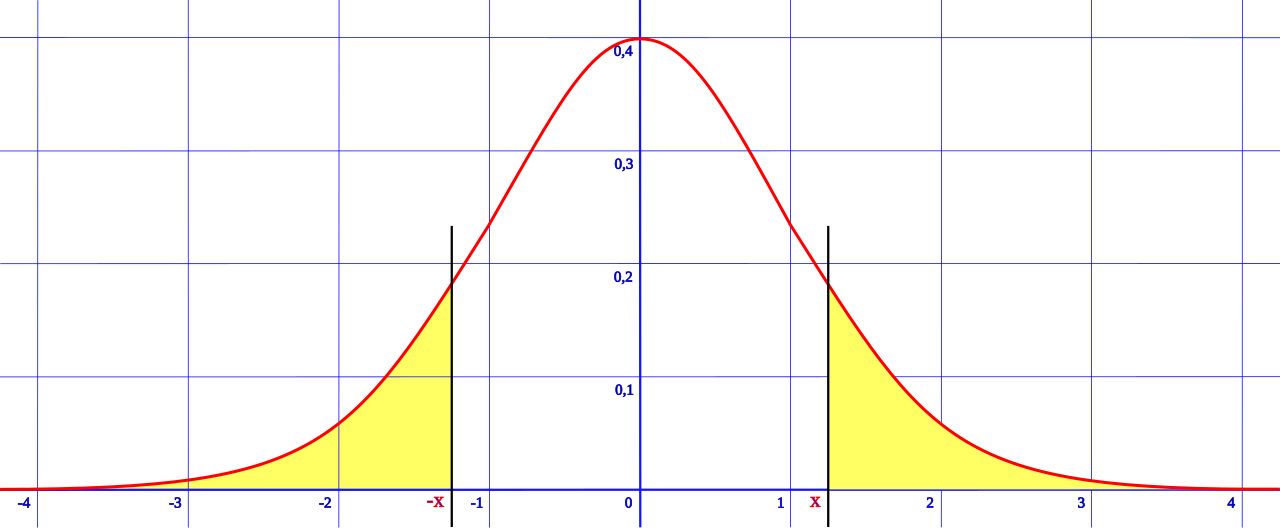
In a two-tailed test, we are asking is the result unlikely
in either direction. So if we set α = .05,
we are asking is it in the 2.5% area of either tail.
If we are doing a one-tailed test, we want to know if
the result is in the 5% tail on the side that interests
us.
So we could ask, "Is the result of using this drug
significant at α = .05 in a two-tailed test?"
This means "Did the drug produce results either
so good or so bad that we should
expect this result less than 5% of the time by chance?
Or we could ask, "Is the result of using this drug
significant at α = .05 in a one-tailed test?"
If our tail is the positive one, we are asking,
"Should we expect a result this good
less than 5% of the time by chance?"
And the opposite for the negative tail!
The difference: in a two-tailed test, we are
asking, "Did this drug have any extreme impact,
either good or bad?"
In a one-tailed test, we are asking, "Did the drug have
a very good (or bad) impact?"
The equation for the standard deviation of the sample means is:

What does this signify? We need to know the SD of the
population as a whole. Once we know that, we know that
the SD of the sample means will come closer and closer
to the population mean, in proportion to the square root
of the number of items in the sample we take.
The square root bit explains why it is often
not economical to increase the sample size beyond
a certain amount to achieve a lower &σ;M:
while increasing the sample size by four times will likely
increase the cost of the sampling by four times, it will
only decrease the SD of the sample mean by two times.
The equation for the z test is:

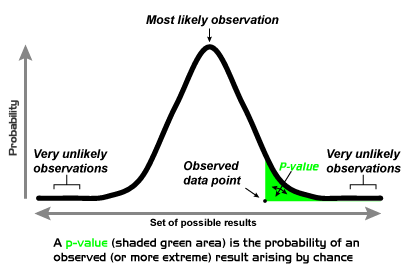
When the results of a test like this are reported,
we will find a statement like:
"There was evidence the HS students who had low GPAs
had lower SAT scores (M = 467) than the general
population (z = -2.31, p < .05)."
When we do this test, we are asking, "Given a sample mean,
how likely is that sample mean for a given range of
population means?"
So we need to calculate σM, as in the
earlier section. Then we use that SD and the z table to get
our range.